Almost a year ago I blogged about
Metrics and Graphite. Since then graphite has become an increasingly used and important tool used by all teams at my current customer. Graphite is used in many interesting ways, not only to monitor, visualize and understand a complex distributed system but to understand user behavior, A / B testing analysis and much more.
The default graphite web is not that great, it is cumbersome to construct dashboards and graphs and does not allow click and drag to zoom in on an area of interest in a graph. As a result of this there are many alternative dashboards for graphite, some that focus on a narrow use case like presenting many metrics, and some that just try to improve on some aspect (like zoom in, client side rendering, nicer looks, etc). Most require editing of json files to construct the dashboards and define the graphs.
About 4-6 months ago I introducing
Kibana at my customer, an INCREDIBLE search and visualization dashboard for logs. All our application logs are feed into Elasticsearch and become instantly searchable in Kibana that can show trends per application, server, or specific error or message and much more. Kibana is a single page, client side only application that lets you construct dashboards filled with different types of panels that show results of your log queries in useful ways. I will try to blog more about Kibana and how incredibly helpful it is!
Anyway, Kibana has a great architecture and ui design for creating dashboards and organizing panels into rows and columns. Something I felt was missing in all graphite dashboards. So I started by creating a copy of the histogram panel in Kibana and added graphite support. It was done relatively quickly. With only that step done I already could construct dashboards full with graph panels, click and drag to zoom in, save dashboard and load dashboards to/from Elasticsearch.
It was then that I realized that this could actually be a pretty great general purpose graphite dashboard. If I focused a lot on graph editing and composing it could fill a gap in the current alternative dashboards.
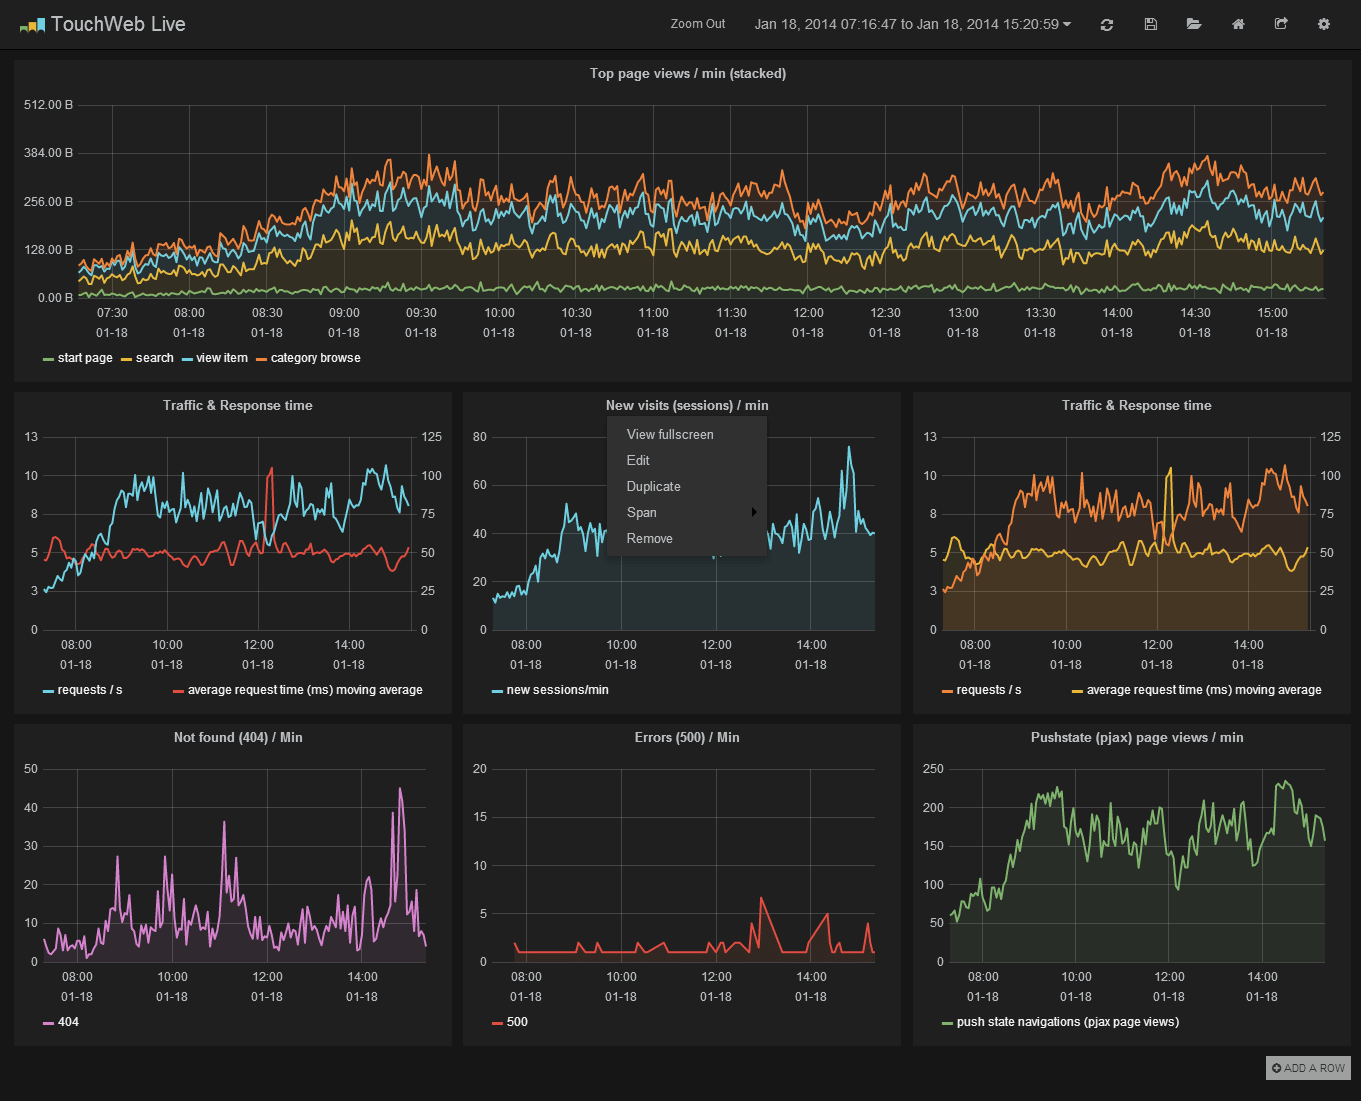
So after a very intensive December and January where I coded almost every free hour I could find (in spare time, not work time) I managed to create a graphite dashboard which I named
Grafana. I created a website for it (
grafana.org) to showcase its features.
One of its many signature features is a graphite expression parser that allows better editing of functions and parameters. It also makes understanding and reading graphite target expressions much easier.
Example:
alias(summarize(sumSeries(prod.apps.touchweb.*.timers.requests.startpage_index_get.count),'1min'),'start page')
An expression like the one above is in Grafana visualized as:
You can click any metric segment to select alternatives, click on the function and edit parameters. You can click the pen and edit the target expression in a text box if you want.
Since the initial release of Grafana the response and feedback has been amazing. Over 1238 starts on github, 91 closed issues, 41 open, 9 releases with many fixes and new features. In Grafana 1.4 which was recently released I added support for annotations.
View this video for a quick intro and a tour of the features in Grafana.
Github project:
github.com/torkelo/grafana