I have been very busy the last couple of months working on my open source project Grafana. New releases and new project web site.

I was recently in the US speaking at a great conference called Monitorama. The video is now online:


Live demo site

You can try Grafana & Graphite at play.grafana.org


Almost a year ago I blogged about Metrics and Graphite. Since then graphite has become an increasingly used and important tool used by all teams at my current customer. Graphite is used in many interesting ways, not only to monitor, visualize and understand a complex distributed system but to understand user behavior, A / B testing analysis and much more.

The default graphite web is not that great, it is cumbersome to construct dashboards and graphs and does not allow click and drag to zoom in on an area of interest in a graph. As a result of this there are many alternative dashboards for graphite, some that focus on a narrow use case like presenting many metrics, and some that just try to improve on some aspect (like zoom in, client side rendering, nicer looks, etc). Most require editing of json files to construct the dashboards and define the graphs.

About 4-6 months ago I introducing Kibana at my customer, an INCREDIBLE search and visualization dashboard for logs. All our application logs are feed into Elasticsearch and become instantly searchable in Kibana that can show trends per application, server, or specific error or message and much more. Kibana is a single page, client side only application that lets you construct dashboards filled with different types of panels that show results of your log queries in useful ways. I will try to blog more about Kibana and how incredibly helpful it is!

Anyway,  Kibana has a great architecture and ui design for creating dashboards and organizing panels into rows and columns. Something I felt was missing in all graphite dashboards. So I started by creating a copy of the histogram panel in Kibana and added graphite support. It was done relatively quickly. With only that step done I already could construct dashboards full with graph panels, click and drag to zoom in, save dashboard and load dashboards to/from Elasticsearch.

It was then that I realized that this could actually be a pretty great general purpose graphite dashboard. If I focused a lot on graph editing and composing it could fill a gap in the current alternative dashboards.

So after a very intensive December and January where I coded almost every free hour I could find (in spare time, not work time) I managed to create a graphite dashboard which I named Grafana. I created a website for it (grafana.org) to showcase its features.

One of its many signature features is a graphite expression parser that allows better editing of functions and parameters. It also makes understanding and reading graphite target expressions much easier.

Example:
alias(summarize(sumSeries(prod.apps.touchweb.*.timers.requests.startpage_index_get.count),'1min'),'start page')

An expression like the one above is in Grafana visualized as:


You can click any metric segment to select alternatives, click on the function and edit parameters. You can click the pen and edit the target expression in a text box if you want.

Since the initial release of Grafana the response and feedback has been amazing. Over 1238 starts on github, 91 closed issues, 41 open, 9 releases with many fixes and new features. In Grafana 1.4 which was recently released I added support for annotations.

View this video for a quick intro and a tour of the features in Grafana.


Github project: github.com/torkelo/grafana


Your starting a new web project and you want to use sass/less for css and require.js for javascript dependency management. Maybe you want to use jslint/jshint to verify your javascript syntax and csslint to verify your css. To make this a smooth developing experience you want to run a background file watcher that runs tasks whenever you change a file.

So when you modify a javascript file, all js files are verified for syntax, require js optimizer is executed to traverse your dependency tree (and spits out combined files). Maybe javascript tests are executed on the fly as well. Same thing when you modify a sass file you want the generated css to be created behind the scenes automatically.

I have used psake (Powershell build script framework) for almost all my build scripts lately. I am not a big fan of Powershell, at least the Powershell syntax. But psake makes writing build scripts a lot easier than msbuild ever has.

I wrote a little powershell utility function that sets up file watchers that when triggered executes a psake task.

Example:

task Watch {
	WatchFiles "$scripts_dir" "*.js"  "JsCheck"
	WatchFiles "$touch_test_proj_dir\JavaScript" "*.js"  "JsCheck"
	WatchFiles "$styles_dir" "*.scss" "Sass"
}

Whenever a js file is modified in the scripts folder (or subfolders) execute psake task JsCheck (this task will run jshint, require js optimizer, and javascript tests).

Here is the gist for the WatchFiles function:

The only trouble I had was dealing if duplicate events, the .NET file watcher class is a little buggy, generating duplicate file changed events which required a little hack to filter them out.

There are many file watchers for node / grunt but I found them a little buggy and CPU intensive. And by using powershell and a regular .NET file watcher does not block the console, you can still use the Powershell console that is running the file watchers.

Growlimageimage


Another thing that is very nice to have when you run background tasks is notification when things go bad or good. This is where Growl for Windows is handy. If a powershell psake task throws an exception I can call growlnotify like this:

function growl($title, $message, $icon) {
   if (Test-Path "C:\Program Files (x86)\Growl for Windows") {
      $iconUri = ([system.uri] "$base_dir\build\images\$icon.png").AbsoluteUri
      Write-Host $iconUri
      & growlnotify /t:$title /i:"$iconUri" "$message"
   }
}

That way you instantly know when you have missed a comma, broke the code style guidelines, wrote the wrong require js dependency path etc.

I have been spending a lot of time thinking about and playing with Metrics. It started as an innovation project at my current customer but I have had a hard time not to think and work on it on my spare time.
image
It all centers around a small metrics framework that pushes application performance timing, health, and most importantly business counters and metrics to a backend system called Graphite. Graphite is a real time scalable graphing system that can handle a huge amount of metrics. You can define flexible persistence and aggregation rules, and most importantly you can plot your metrics in graphs using a large amount of flexible functions. Functions that can combine metrics, stack metrics from different servers, calculate percentiles, standard deviation, moving average, summarize, filter out outliers, etc.
I wrote a small metrics framework that can handle counters, gauges and timers. These are aggregated and sent to Graphite via UDP every x seconds (depending on how real time your want your metrics).
image
image
Examples of how to increment a counter and time a lambda function. The real power comes from how graphite can aggregate metrics from all production servers, compare or summarize them.
Example:
image

 aliasByNode(test.servers.*.gauges.cpu.processor_time, 2)
With a single line like this we can stack cpu usage on all test servers (notice the wild card in the above expression). New test servers would automatically appear in the above graph.
You can also aggregate metrics from different servers like this:
 sumSeries(carbon.agents.*.metricsReceived)
Graphite gives you a lot control of how to persist and aggregate metics in the backend as well.
storage-schemas.conf
[stats]
pattern = ^prod.*
retentions = 10s:6h,1min:7d,10min:5y
This translates to: for all metrics starting with 'prod' , capture:
  • 6 hours of 10 second data
  • 1 week of 1 minute data
  • 5 years of 10 minute data
In another config file you specify how metrics should be rolled up (for example how 10 second data should be rolled up / aggregated to 1 minute data). For example you want counters to be summed, and timings to be averaged.
You can also have a graphite aggregator that aggregates and persists aggregated metrics. For example most of the time you don’t want to see business metrics split per server so to make it easier to plot graphs you can have graphite create and persist an aggregated metric for you (this could be done by graph functions as well). This is can be done using format rules like this:
<env>.applications.<app>.all.counters.<metric_name> (60) = sum <env>.applications.<app>.*.counters.<metric_name>
Given metrics with names like:
 prod.applications.member-notifications.server-1.counters.order_mail_sent 
 prod.applications.member-notifications.server-2.counters.order_mail_sent
 prod.applications.member-notifications.server-3.counters.order_mail_sent
 prod.applications.member-notifications.server-4.counters.order_mail_sent
Graphite will every 60 seconds summarize the counter received for each server and generate a new metric with name name “all” instead of the server name.
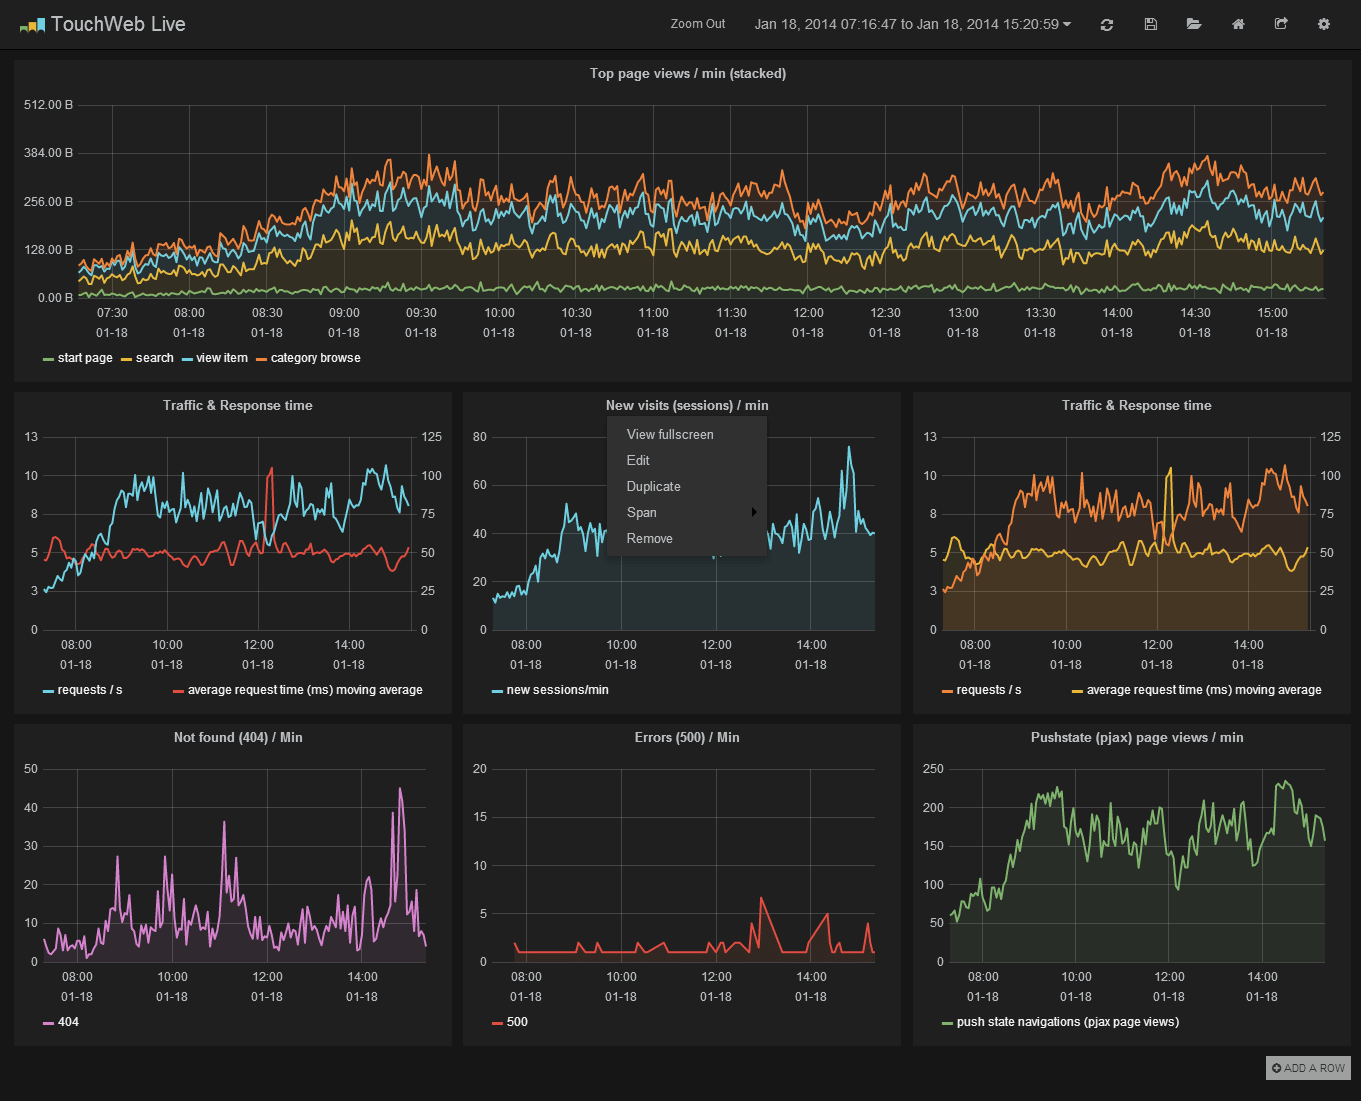
Graphite is bundled with a web application that lets you view and create graphs and dashboards (shown in the first screenshot in this blog post). The standard graphing component utilizes image based graphs. There is an experimental canvas based graph as well but it is not very good. Luckily there are a great number of alternative frontends for graphite that support live graph dashboards that use canvas or svg graphics. I like Giraffe, but its styling was not very nice, so after a quick css makeover it looked like this:  
image
With Giraffe and other svg/canvas based dashboards and graphing engines you can get real time moving graphs (graph data is fetched from graphite HTTP API).
There is a large community built around Graphite, with everything from metric frameworks, machine metric daemons, alternative frontends, support tools and integration with monitoring systems like Nagios and Ganglia.
Graphite is not easy to install and setup (do not even try to get it running on windows). And it takes time to understand it’s persistence model and configuration options. It is extremely specialized to do one thing and one thing only: persist, aggregate and graph time series data. This specialization is also it’s strength as a single Graphite server can handle millions of metrics per minute and store them in a very optimized format (12 bytes per metric per time interval). So 6 hours of 10 second data is just 2160 bytes per distinct metric.
Lets say you have 10 servers with 2 applications, each application sends 200 distinct metrics (business counters, performance timings, operation metrics, etc) every 10 seconds. The storage required for 6 hours of data: 10 (servers) * 2 (applications) * 200 (distinct metrics) * 6 (measures per minute) * 60 (minutes) * 6 (hours) = 8640 KB
Metrics older than 6 hours will be rolled up into one minute buckets which will reduce storage to 1/6th of the above.
Links:
Update (2014-02-23): 
I have since this post created a new graphite dashboard replacement called Grafana, visit grafana.org for more info!. 

I have been working a lot with node.js lately and some Nancy (low weight .net web framework). I love how explicit they are in the HTTP interface you define and how they allow you to structure your application as you find appropriate (for example around features or feature groups).

Node.js example:

image

Nancy example:

image

They give you full control how you structure and organize http handlers (code, folders, view locations). So when I now started a new ASP.NET MVC project I am struck by how awkward I find the default mvc folder structure and url –> controller routing mechanism.

Default ASP.NET MVC project folder structure:

image

Having Controllers, Models and Views in the root folder feel strange to me, they are basic building blocks in mvc projects and have nothing to to do with features or the application domain. ASP.NET MVC has support for areas which allow you to organize your code around application domains or features but the default controllers and views cannot be in an area folder. Try for example to have an controller in an area be your default route and it will be looking for views in the default root view folder.

Luckily MVC is extensible enough to partially solve this. We can move the default controllers, views and models into a “default” area folder, this won’t really be an area in the same sense as other areas. Because we will trick ASP.NET MVC to look for “no area” views and controllers in this folder instead.

image

By removing the standard Razing engine and instantiating a new we can modify the view location formats to make razor look for views for the “no area” routes/controllers in the default folder inside the areas folder. Now we can clean up the root folder structure.

image

This feels so much better, we can have default views and layouts in the default area folder, maybe a few controllers but preferably every controller should be placed within an area (feature / feature group). I still find the url –> controller action routing obstructing the clarity and simplicity of HTTP, but it has it uses. Also the whole area feature in ASP.NET MVC feels tacked on and not well implemented as they complicate all url routing and url generation. When using areas Url, Action and Form helpers need to be told which area the controller you are referring to resides.

image 

This can be overcome by using smart lambda based (typed) helpers: 

image

But sadly no such helpers come included in vanilla ASP.NET MVC (they did/do exist in MVC Futures and MVC Contrib if I remember correctly). Anyway after this small change I feel a little better using ASP.NET MVC, still miss node.js though.

It is not uncommon when when writing tests that you want check that the correct items with correct data exists in a list. You can do this in many ways, most of which I have found to be problematic at times.

Example:

image

This approach forces the item order to be the one you expect. This can be overcome by sorting the list before. Another approach that I do not like, but have seen a lot:

image

This approach do not care about the order of the items, but will not generate instructive errors. When the test fails you get no hint of which property was wrong, was there any items in the list, was it the project number or the quantity that caused the mismatch?

I have been working on a reporting story that denormalized a big document into a single class with a large number of properties. This required a number of tests that checked the items and their generated properties. However I wanted a nice syntax and good instructive test errors that explain what property caused the mismatch and what alternative values that property was found with.

I set out to create this in a generic way to be reusable in other tests. And ended up with this:

image

Lets say there only exists an item with project number 123 and placement “Front”, and maybe 10 rows with other project numbers, then the fist line would throw a test fail like this:

image

The important point here is that not only do I get what property caused the mismatch but also the alternative values for that value given the project number filter of 123 (that is I do not get all values for the mismatched property). 

This becomes useful when you have many properties and multiple rows you want to check. Because all filters that results in hits will be applied, and all that give no hits will not be used, so you can present an error that includes the mismatches, but also found alternative values for the mismatched properties. I am not sure if I am making any sense. 

Maybe the filter logic will help, CollectionTestHelper:

image

I try to filter the list using the property function and value, if no hits are found I revert to the “unfiltered” list and add the property expression and value to a dictionary. I then revert to the “unfiltered” list, which is a bad term as it is the list with all matching filters applied.

The complete code for the CollectionTestHelper look at this gist: https://gist.github.com/1509663

In one case I made a helper method in the test class that has 14 optional parameters, so I can get this syntax:

Example:

image

Optional parameters are great for making tests and setups clearer.

What i like about command query segregation is that it allows you to clearly distinguish between operations that modify states (via persisting aggregates) and queries that only read. Reads require very little business logic or behavior so why do many system still handle reads the same way (architecturally speaking) as writes? Why do reads need to pass through a domain repository, a domain entity and (god forbid a domain “manager” class), then only to get mapped to a DTO and later a view model?

Realizing the big difference between reads and writes has been the biggest change in mindset for me the last year. When you realize this you can create different architectures and layering for reads and for writes.

For example queries can be handled like this:

image

The above query handler needs to return product details and the order count in which that product exists. No behavior, no business rules, no domain entities or aggregates needed, just data that needs to be returned to later be displayed in a GUI. So no repository needed! So how do you test the query handler? The same way you would test the repository method, using a database test (preferably in-memory).

If you read a whole aggregate in a query handler something is most likely wrong, aggregates should only be read if you need to perform a command (modify it’s state).

Separating between read models and write models makes a huge difference. Write models will be modeled using domain driven design, aggregate roots should correspond to transactional boundaries. Aggregates should not require a change just because we need to display more data in the GUI.  I have seen domain entities filled with relationships and properties only there because some part of the GUI requires it.

If you use your domain aggregates when reading and displaying data it can lead to a huge amount of unnecessary data in the aggregate, data that is never used by the business rules but is still being read from the database on every write operation.

There is an interesting consequence in event sourcing, in that it allows you to create a domain model state that only contains state (data) that is necessary for the behavior, if you have data that is only required for reads then you can ignore that data in your aggregate (it will be stored in the event store, and in the read model).

I am only a novice when it comes to Event Sourcing and CQRS but I find both incredibly interesting. I like how they both create pretty big limitations that force you toward something good, and it makes you think more are about domain driven design, about boundaries and responsibilities and about intent. I would love to get the chance to try event sourcing and pure CQRS (separate read/write model and persistence) in a real project.

For more on CQRS: